EN | FR
Optima’ Dash

Visual crypto alerts
and chart patterns
for iPhone and iPad

A dashboard designed to make market
information easier to understand,
whether you are discovering crypto
or already follow the markets regularly.

Explore the free app on the App Store

Explore the dashboard ↓
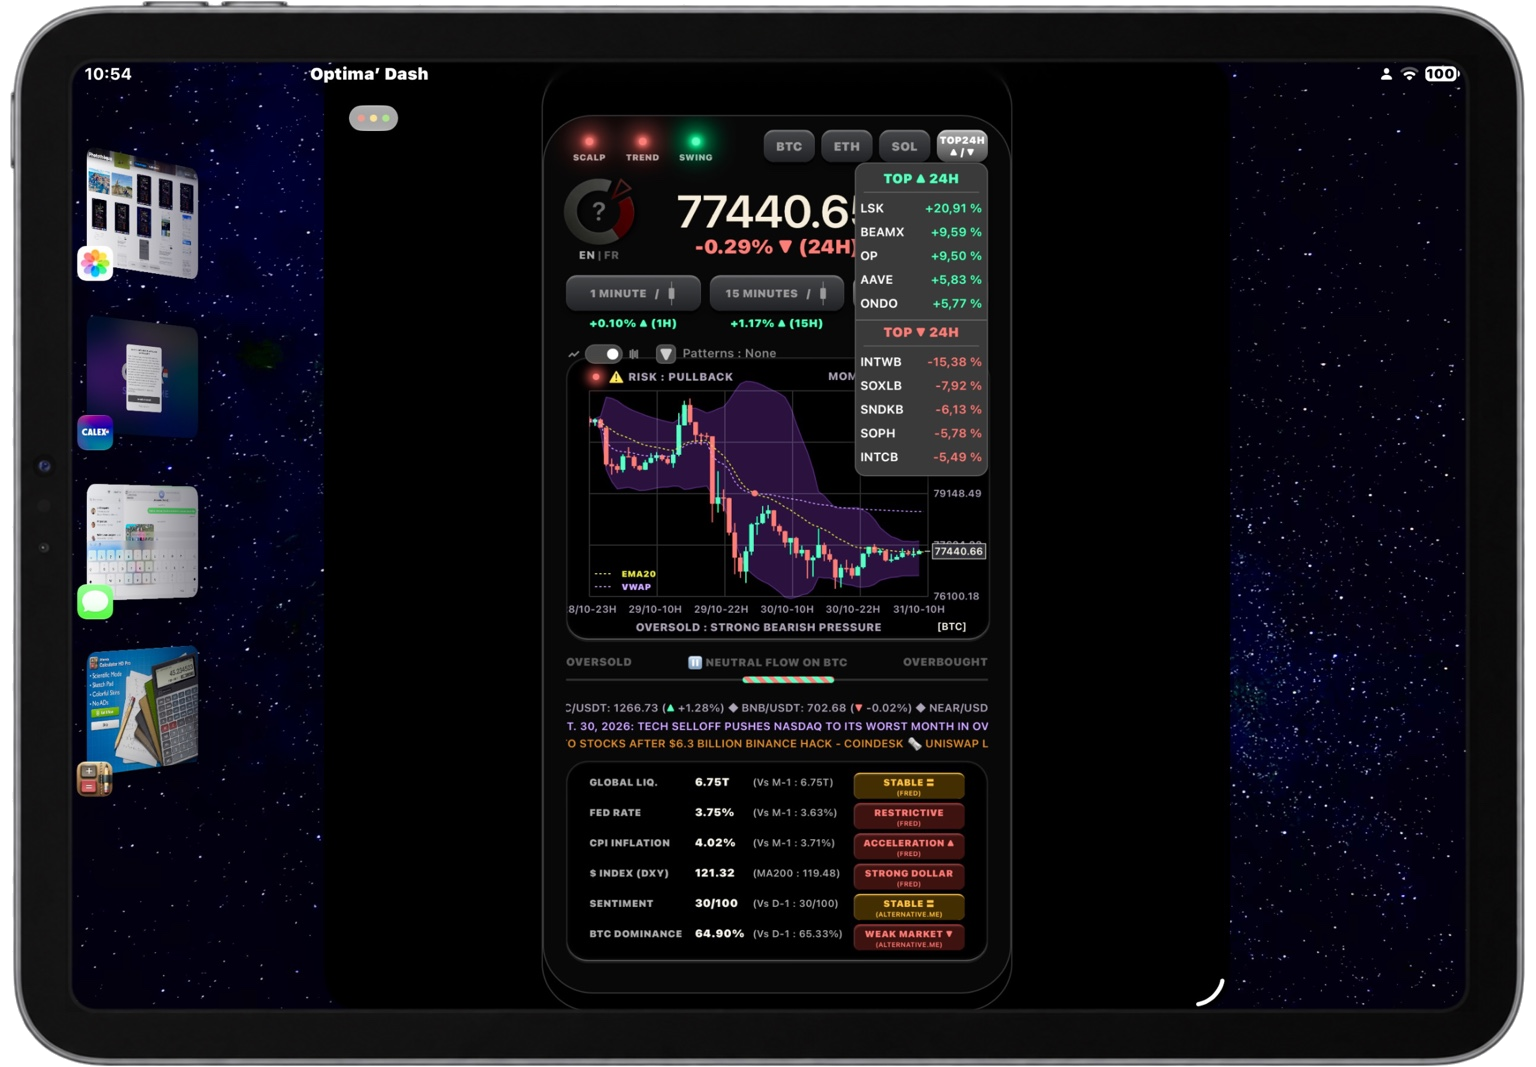
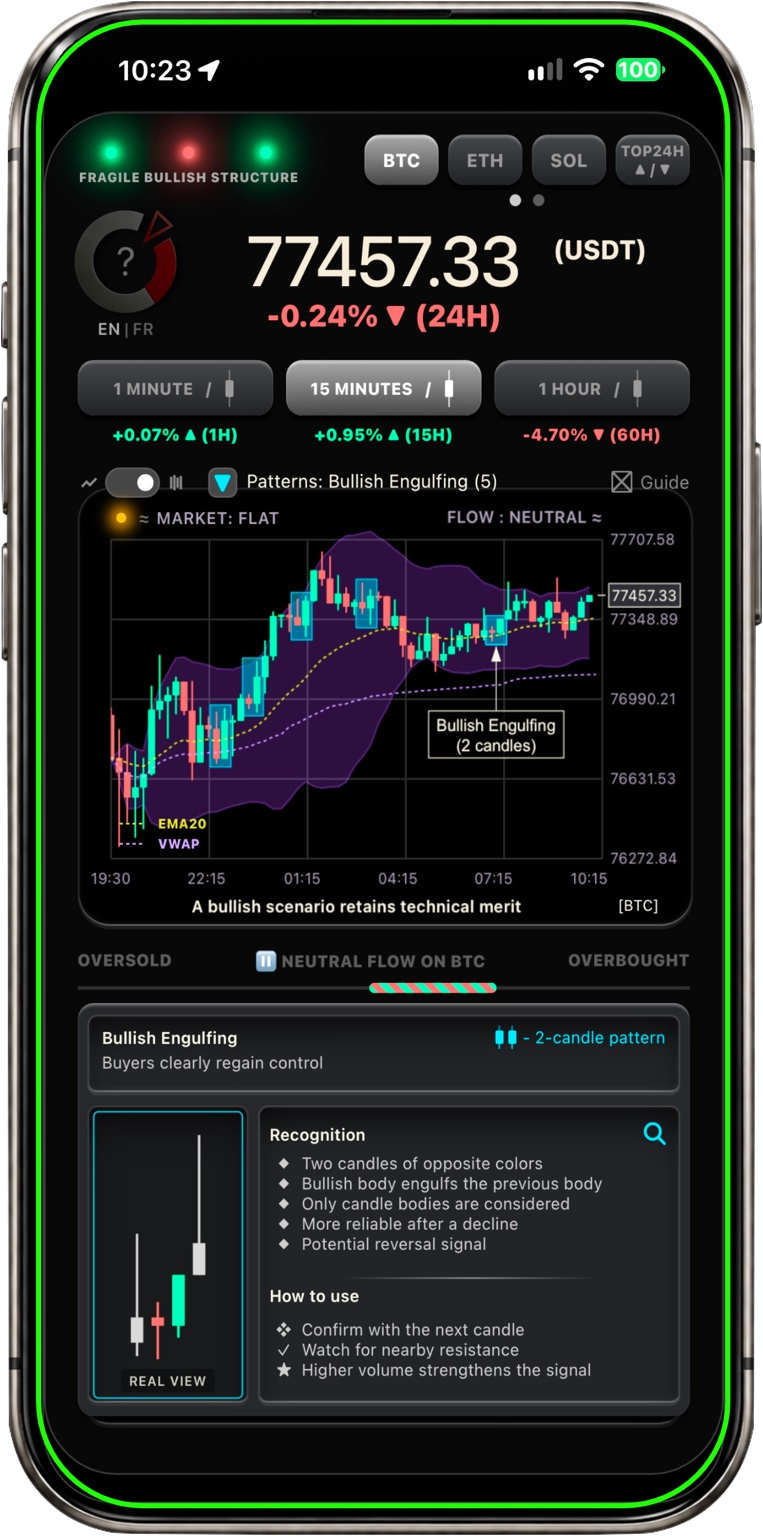
Optima’ Dash crypto market dashboard on iPad Candlestick pattern explanation in Optima’ Dash on iPhone
Understand before going further

Follow crypto market activity without switching between multiple screens and sources.

Optima’ Dash lets you monitor
crypto market activity
at a glance.

Whether you are discovering crypto or already follow the markets regularly, the app brings together on a single screen the essential information you need to better understand market movements: prices, trends, visual and text-based alerts, technical signals and candlestick patterns, market sentiment and economic context.

No need to be a specialist to get started.

The LITE version lets you explore Optima’ Dash’s main features for free, while the PREMIUM version provides broader analysis and more tools to go further.

Optima’ Dash is an information and analysis tool: no trading account, deposit of funds or connection to an exchange platform is required.

Everything in one place

From a simple market overview
to more detailed analysis.

↗ Prices and trends

Monitor cryptocurrency prices, quickly see market trends and easily identify changes.

◎ Visual and text-based alerts

Color-coded alerts and text messages in the A/B/C chart zones highlight market movements. SCALP, TREND and SWING signals include commentary in PREMIUM.

Chart patterns

Identify characteristic candlestick patterns, discover what they mean and learn to recognize them more easily.

Technical indicators

EMA20, VWAP and Bollinger Bands provide additional reference points for better analyzing market movements.

◔ Market sentiment

Put observed movements into the broader context of crypto market sentiment and assess its direction more easily.

Global context

Put your analysis into a broader context with macroeconomic data, the US dollar and Bitcoin dominance.

Two levels of use

Start with LITE.
Go further with PREMIUM.

LITE

Explore for free

A complete first look at the market to explore Optima’ Dash without a subscription.

  • 10 cryptocurrencies available
  • 3 timeframes: 1 min, 15 min and 1 h
  • Candlestick charts, EMA20, VWAP and Bollinger Bands
  • Neutral trend signals and visual reference points
  • TOP 24H: a preview of gainers and losers (1 + 1)
  • 5 common candlestick patterns
  • Essential macroeconomic data
  • Built-in scrolling help guide
PREMIUM

Go deeper into the analysis

A broader view of the market with more information and analysis tools.

  • Color-coded visual alerts, steady or pulsing, plus text alerts in A/B/C chart zones
  • Commentary on SCALP, TREND and SWING signals
  • 50 cryptocurrencies ranked by trading volume, including 4 savable favorites
  • TOP 24H: 5 top gainers and 5 top losers, with direct access to charts
  • Automatic detection of 19 candlestick patterns, with explanatory guides
  • EMA20 / VWAP crossovers highlighted visually
  • Color-coded market indicator with diagnostics
  • Enhanced macroeconomic data and historical comparisons
  • Interactive on-screen help by touch area
Observe. Understand. Go further.

A clear overview of the market,
directly on iPhone and iPad.

Optima’ Dash brings together in one interface information usually spread across multiple tools and sources.
This gives you a clear overview without having to switch between multiple apps or screens.

Explore the market at your own pace, discover indicators and patterns, and gradually deepen your analysis. LITE lets you get started for free, while PREMIUM provides a more complete view.

 View Optima’ Dash on the App Store
How the app helps you read the market

Visual crypto alerts and candlestick patterns: questions answered

What are visual crypto alerts?

In Optima’ Dash, visual alerts are cues displayed inside the dashboard. In Premium, coloured borders highlight EMA20/VWAP crossings, while steady or pulsing colour cues and text in the A/B/C chart zones draw attention to changing market conditions. They help you interpret the chart you are viewing.

How can I understand crypto candlestick patterns?

Open a detected pattern’s explanatory card to connect its shape with an explanation. Lite includes five patterns: Standard Doji, Bullish Engulfing, Bearish Engulfing, Bullish Hammer and Shooting Star. Premium expands access to 19 patterns and their guides. A pattern provides context; it does not guarantee the next price movement.

Can I follow Bitcoin, Ethereum and Solana in one app?

Yes. BTC, ETH and SOL have direct selection buttons. Switch between 1-minute, 15-minute and 1-hour charts, with EMA20, VWAP and Bollinger Bands. TOP24H highlights gainers and losers; four memory buttons give quick access to saved favourites from the available cryptocurrency selection.

Do I need an exchange account or a subscription?

No exchange account, deposit or trading connection is required. You can start with the free Lite version. Premium adds colour-coded analysis, commented SCALP/TREND/SWING signals, a selection of 50 cryptocurrencies and the full pattern library. The app supports English and French.

Read the English FAQ and Lite/Premium details